
One of the relatively well-known elements of NHL history is that the 1980s were a decade of incredibly high scoring. While over the last 20 seasons the NHL has held pretty steady around five to five-and-a-half goals scored per game, in the 1980s games were averaging nearly two more goals per game. That’s not an insignificant difference, considering that games in a low-scoring league like the NHL are often decided by two goals or less. This has led to a lot of speculation, as people have both wondered at the reasons for those high scoring levels, as well as pondered how to increase scoring in today’s league. The most-accepted reasons are, for the most part, disappointingly unique for people looking to improve today’s offense: league expansion brought an influx of offensive talent (with the 1979 World Hockey Association-NHL merger, four teams were suddenly added to the 17-team league), goaltending equipment and techniques were sparse and out-of-date, and late 1960s/70s innovations (curved stick blades and offensive-focused defensemen) were elevating offensive production. While looking at the age distribution of NHLers, I found something that also could be included as an explanation.
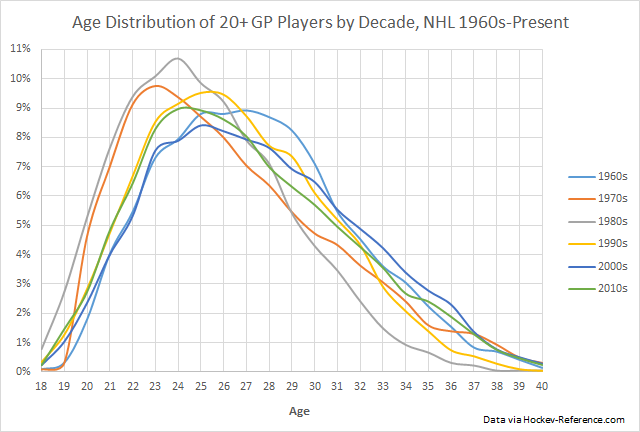
What you’re looking at above is the proportion of the league’s regular players in each age-cohort. Generally speaking, this is a useful distribution for understanding things like “peak” player performance and player value, which was my initial reason for pulling the data. Whether today or in the past, as far as hockey is concerned players generally peak around ages 23 to 26 or so, and decline after age 29. Teams have likely known this for longer than they let on; collective bargaining has often found NHL owners pushing hard for maintaining full rights to drafted or acquired players up to age 30, and in recent decades up to age 27. Artificially-cheap entry-level contracts, three years in length, do not start counting those years till a player is officially in a professional league (typically, the NHL or its farm affiliates, the American Hockey League and East Coast Hockey League)…and such players are likely already in their early 20s.
More recent research by current Carolina Hurricanes VP of Management & Strategy, Eric Tulsky, adjusted the peak age a bit further back than previous analysis, more towards age 23, a shift reaffirmed by even-more-recent analysis by the researchers of the site Evolving Wild in their post at Hockey Graphs. Both pieces bucked convention that had maintained defensemen “matured” at a later age; rather, defenders also fell in line with an early peak in performance.
Coming back to the graph above, then, let me blot out our distributions from the 1960s, 1990s, 2000s, and 2010s and focus in on the peak scoring period in NHL history:
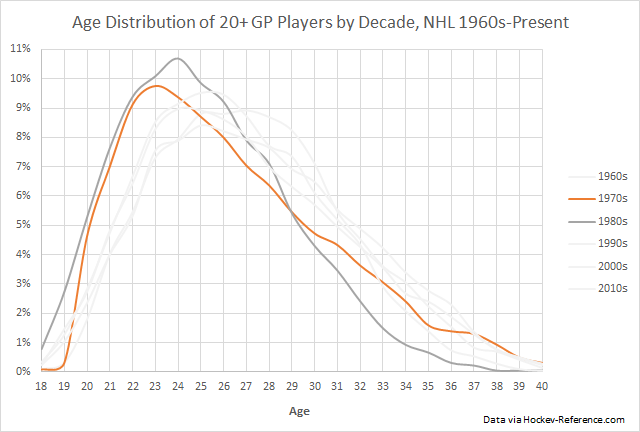
Clearly, the 1970s and 1980s featured a younger league, with more players within the peak. So, in addition to an offensive influx from the WHA — wherein the NHL was able to select the cream of the crop — the league was simultaneously pushed by the WHA towards younger and potentially better overall talent. Much was made of the financial damage wrought by the split, as many of the WHA teams folded as did an NHL franchise (the California Seals/Cleveland Barons in 1978), but little attention was given to how the shake-up was making for exciting hockey.
And who knows? Perhaps we are realizing that potential once again. Since adding the Vegas Golden Knights, league-scoring has noticeably increased to some of the highest levels since the mid-1990s, and a new team in Seattle will further stir the pot. The league has also moved to decrease goaltender equipment sizes, so the boost of these measures could last for awhile.
In sum, it can seem logical that profound performance changes are tied to individual and team behaviors or utilization, but sometimes we need to zoom out and recognize the potential role of larger contexts.
